
The average medical practice loses $125,000 per physician annually to billing inefficiencies. That is not a guess. It comes from MGMA data covering more than 10,000 practices across the United States. If you run a practice and don’t understand exactly how medical billing works, you are leaving money on the table every single day.
This guide breaks down the entire medical billing cycle, from patient registration to final payment posting. No jargon without explanation, no vague advice. Just the process, the numbers, and the bottlenecks you need to fix.
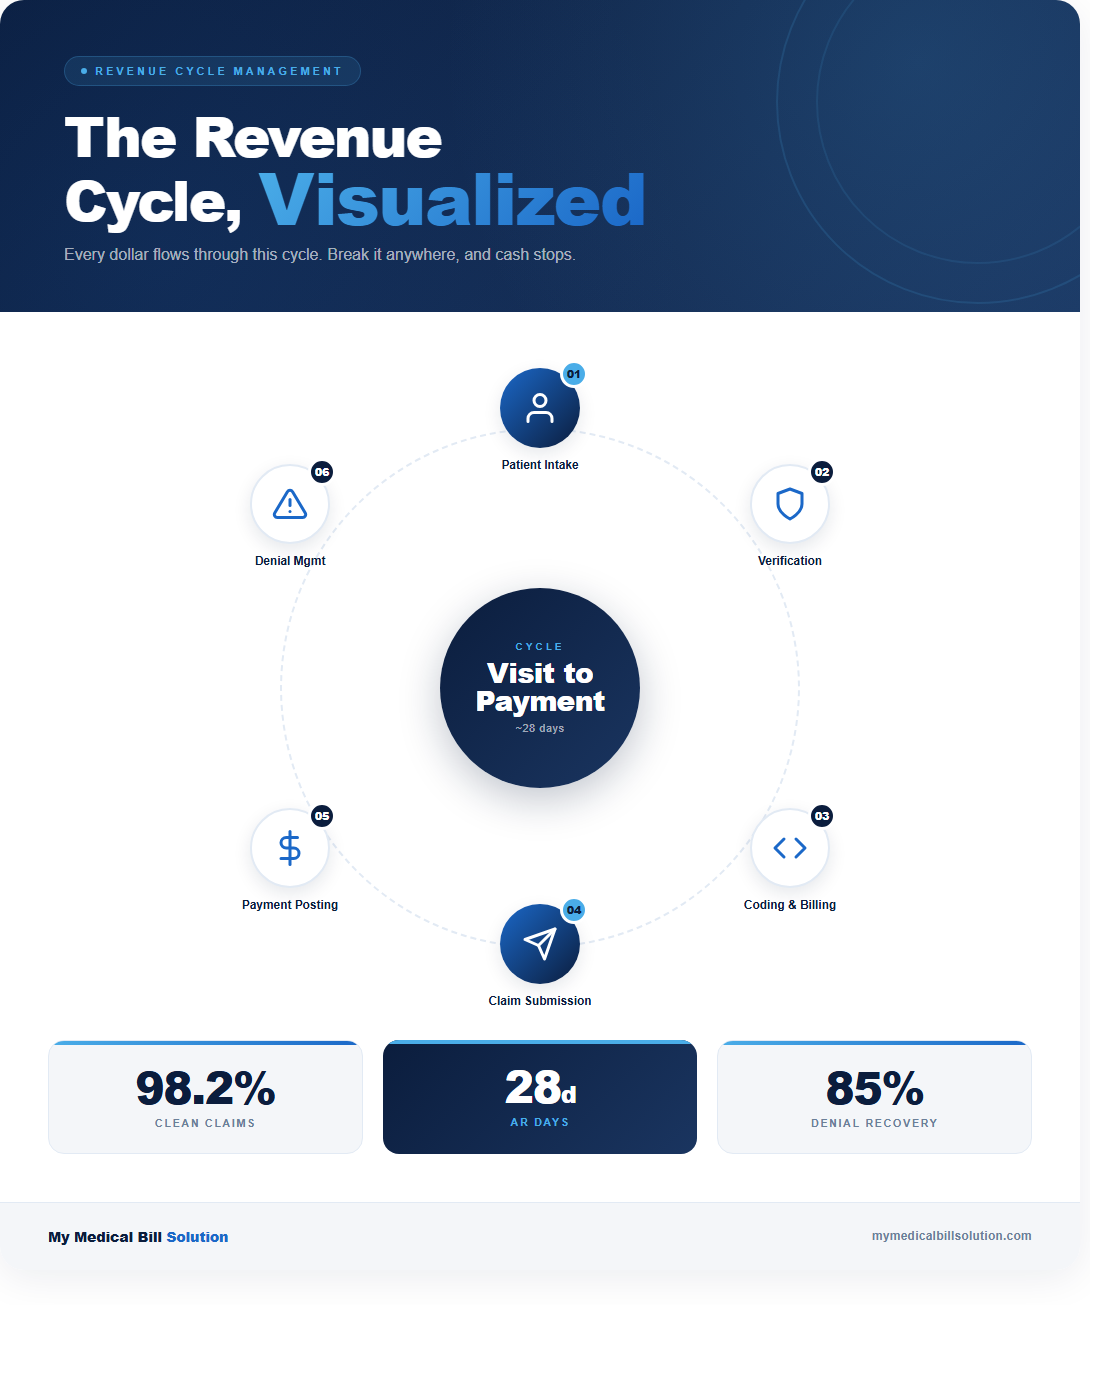
The Medical Billing Cycle: 10 Steps From Visit to Payment
Medical billing follows a structured lifecycle. Every claim moves through these 10 steps, and a breakdown at any stage delays your revenue.
1. Patient Registration and Insurance Verification
This is where 30% of claim denials originate. Staff collect demographics, insurance ID numbers, group numbers, and verify coverage in real time. Skipping eligibility verification before the appointment is the single most expensive mistake a front desk can make. Real-time eligibility tools catch issues before they become denials.
2. Patient Encounter and Documentation
The provider sees the patient and documents the visit. Clinical documentation drives everything downstream. If the physician doesn’t document medical necessity, the claim will fail. Period. The note must support the diagnosis, the procedure, and the level of service billed.
3. Medical Coding (ICD-10, CPT, HCPCS)
Certified coders translate clinical documentation into standardized codes. ICD-10 codes describe the diagnosis (there are more than 72,000 of them). CPT codes describe the procedure or service (roughly 10,000 active codes). HCPCS Level II codes cover supplies, drugs, and durable medical equipment. A single coding error can trigger a denial or, worse, an audit.
4. Charge Entry
Coded services are entered into the practice management system with the correct modifiers, units, and place of service. Common CPT codes like 99213 (established patient, moderate complexity) or 99214 (established patient, moderate-high complexity) must match the documentation exactly. Upcoding triggers audits. Undercoding costs revenue.
5. Claims Scrubbing
Before submission, claims run through automated scrubbing software that checks for errors: missing modifiers, invalid code combinations, demographic mismatches. Good scrubbing catches 85% of preventable denials before they happen. If your clearinghouse rejection rate exceeds 3%, your scrubbing process needs work.
The Submission and Payment Phase
6. Claim Submission
Clean claims go to payers electronically through a clearinghouse. The industry standard is the ANSI 837 electronic format. Paper claims (CMS-1500 forms) still exist but take 2 to 3 times longer to process. Medicare processes 95% of clean electronic claims within 14 days. Paper claims average 29 days.
7. Payer Adjudication
The insurance company reviews the claim against the patient’s benefits, fee schedules, medical necessity criteria, and contractual agreements. Three outcomes are possible: paid in full, paid partially, or denied. The national average first-pass resolution rate is 70 to 85%. Top-performing practices hit 95% or higher.
8. Payment Posting and ERA Processing
Payments arrive with an Explanation of Benefits (EOB) or Electronic Remittance Advice (ERA). Staff post payments to patient accounts, noting any contractual adjustments, co-pay amounts, and remaining patient responsibility. Automated ERA posting reduces manual entry errors by 90% and cuts posting time by 75%.
9. Patient Billing and Collections
After insurance pays its portion, patients receive statements for remaining balances: co-pays, deductibles, and coinsurance. Patient responsibility now accounts for 30% of practice revenue on average, up from 10% a decade ago. Practices that offer online payment portals collect 40% more patient payments within 30 days.
10. Denial Management and Appeals
Denied claims require investigation, correction, and resubmission. The average cost to rework a denied claim is $25 to $118 per claim. Yet 65% of denied claims are never resubmitted. That is pure revenue loss. Practices with dedicated denial management workflows recover 50 to 70% of initially denied revenue.
Key Revenue Cycle Benchmarks
These numbers tell you whether your billing operation is healthy or bleeding money.
Days in Accounts Receivable (AR): The industry benchmark is 30 to 40 days. If your AR days exceed 50, you have a collections problem. Every day beyond 40 costs your practice 1 to 2% of the collectible amount.
Clean Claim Rate: Target 95% or higher. This means 95 out of 100 claims pass through without rejection on first submission. The national average sits around 80%, which means most practices are leaving 15 percentage points of efficiency on the table.
Denial Rate: Keep it below 5%. The national average is 6 to 13%, depending on specialty and payer mix. Every percentage point in denial rate costs a mid-size practice roughly $50,000 annually.
Net Collection Rate: This measures what you actually collect against what you’re owed after contractual adjustments. Healthy practices hit 96% or higher. Below 90% signals systemic problems.
The Three Biggest Billing Bottlenecks
After analyzing thousands of practice revenue cycles, three problems cause the most damage.
1. Front-End Failures
Registration errors, missed eligibility checks, and incomplete demographics account for 30 to 40% of all denials. The fix is simple: verify insurance before every visit, every time. No exceptions.
2. Coding Gaps
Undercoding is more common than overcoding. Most physicians default to lower-level E/M codes (99213) when documentation supports higher reimbursement (99214 or 99215). The difference between 99213 and 99214 is roughly $40 per visit. For a physician seeing 25 patients per day, that gap adds up to $200,000 annually.
3. AR Follow-Up Neglect
Claims older than 90 days have less than a 50% chance of collection. Claims over 120 days drop to 25%. Yet most practices don’t systematically work aged AR. Building a weekly AR follow-up cadence, prioritized by dollar amount and aging bucket, is the fastest path to revenue recovery.
In-House vs. Outsourced Medical Billing
Running billing in-house gives you control but demands significant investment. A single full-time biller costs $40,000 to $55,000 annually in salary, plus benefits, software licenses, training, and management overhead. Total cost per biller runs $55,000 to $80,000 when fully loaded.
Outsourced billing companies typically charge 4 to 9% of collections. For a practice collecting $1 million annually, that is $40,000 to $90,000. The tradeoff: lower overhead, access to specialized expertise across payers and specialties, and no staffing headaches. The downside: less direct control and dependency on a third party.
The right choice depends on your practice size, specialty complexity, and payer mix. Practices with fewer than 5 providers almost always benefit from outsourcing. Larger groups may find a hybrid model works best.
Technology That Accelerates the Billing Cycle
Practice management systems, automated claim scrubbing, electronic remittance posting, and patient payment portals are not optional anymore. They are baseline requirements for a functional revenue cycle. Practices still running manual processes see AR days 15 to 20 days higher than automated counterparts.
Real-time eligibility verification alone reduces front-end denials by 20%. Automated ERA posting cuts payment reconciliation time by 75%. Online patient portals increase patient collections by 35 to 40% within the first 30 days. The technology investment pays for itself within one to two billing cycles for most practices.
Clearinghouse analytics dashboards also provide visibility into payer-specific rejection trends. If 12% of your claims to a specific payer are bouncing for the same reason, that pattern becomes actionable intelligence rather than background noise.
The Bottom Line
Medical billing is a 10-step process where every step matters. Registration errors cascade into denials. Coding gaps erode revenue. AR neglect turns collectible dollars into write-offs. The practices that master this cycle collect more, deny less, and get paid faster.
Know your numbers. Track your benchmarks. Fix the bottlenecks. That is how medical billing works when it works well.